App Analytics firm Appnie recently releasesd the 2022 State of Mobile Report.
The report provides in-depth analyses for 17 industries and 30 markets and uses an interactive format allowing readers to dive into the rich data and insights.
Takeaways from the 2022 Appnie’s State of Mobile Report:
We are spending more time and money on our mobile phones.
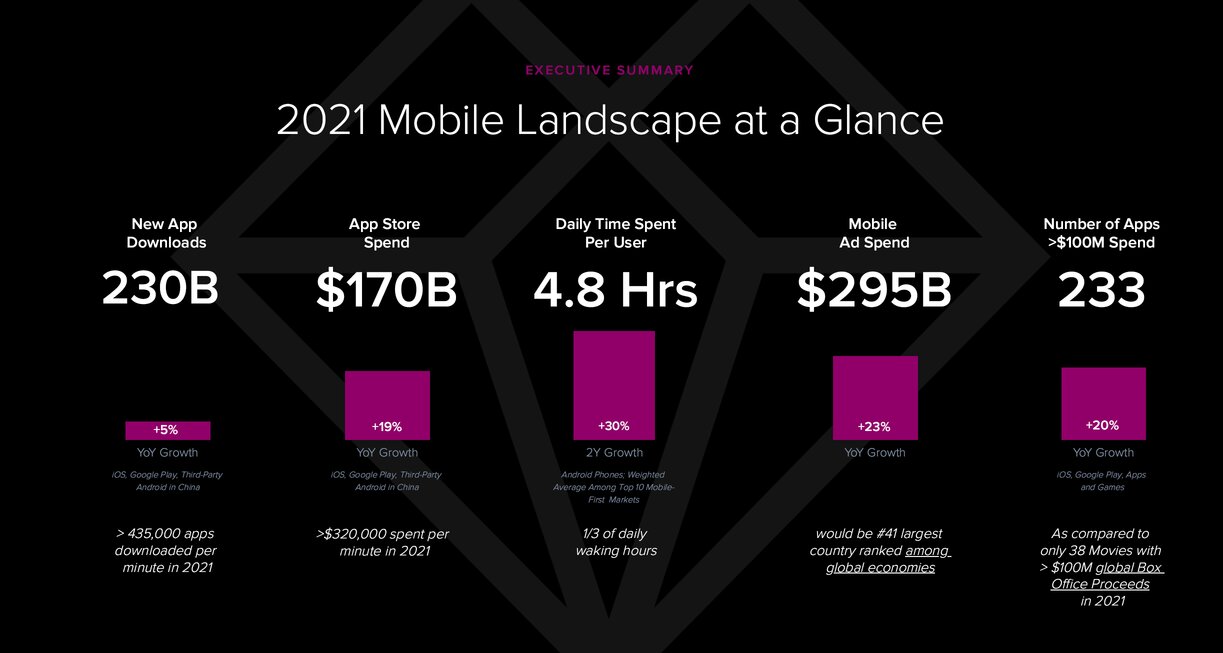
- We are spending 1/3rd of our waking hours on mobile
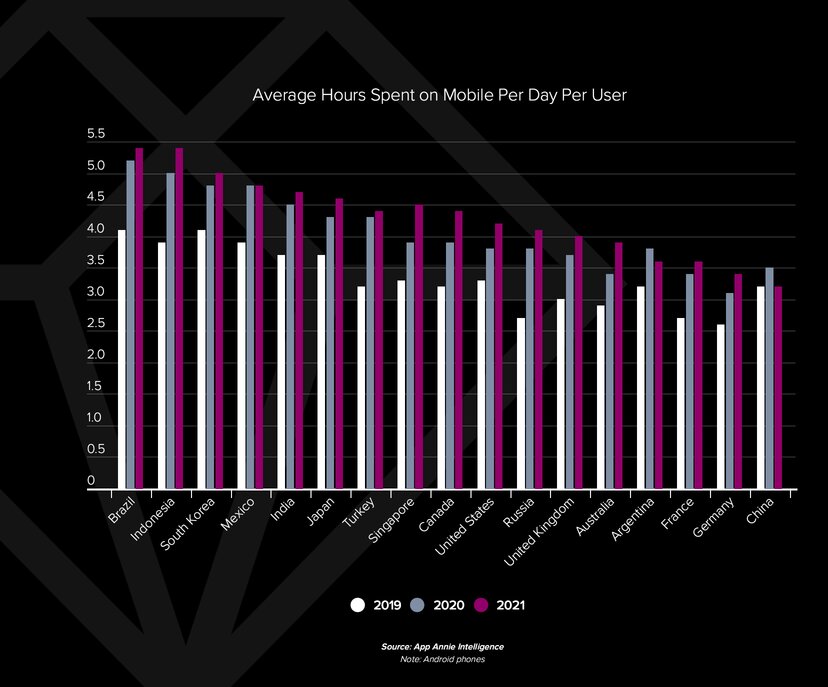
Across the top 10 markets analyzed, the weighted average surpassed 4 hours 48 minutes in 2021 — up 30% from 2019. Users in Brazil, Indonesia and South Korea surpassed 5 hours per day in mobile apps in 2021.
The average American watched 3.1 hours of TV a day, whereas they spent 4.1 hours on their mobile device in 2021.
- We are spending 1/3rd of our waking hours on mobile
- 7 of Every 10 Minutes on Mobile Was Spent in Social and Photo & Video Apps in 2021
As time increases on mobile in emerging categories, consumers are also engaging deeper in early-mover categories like Social, Communication and Photo & Video apps.
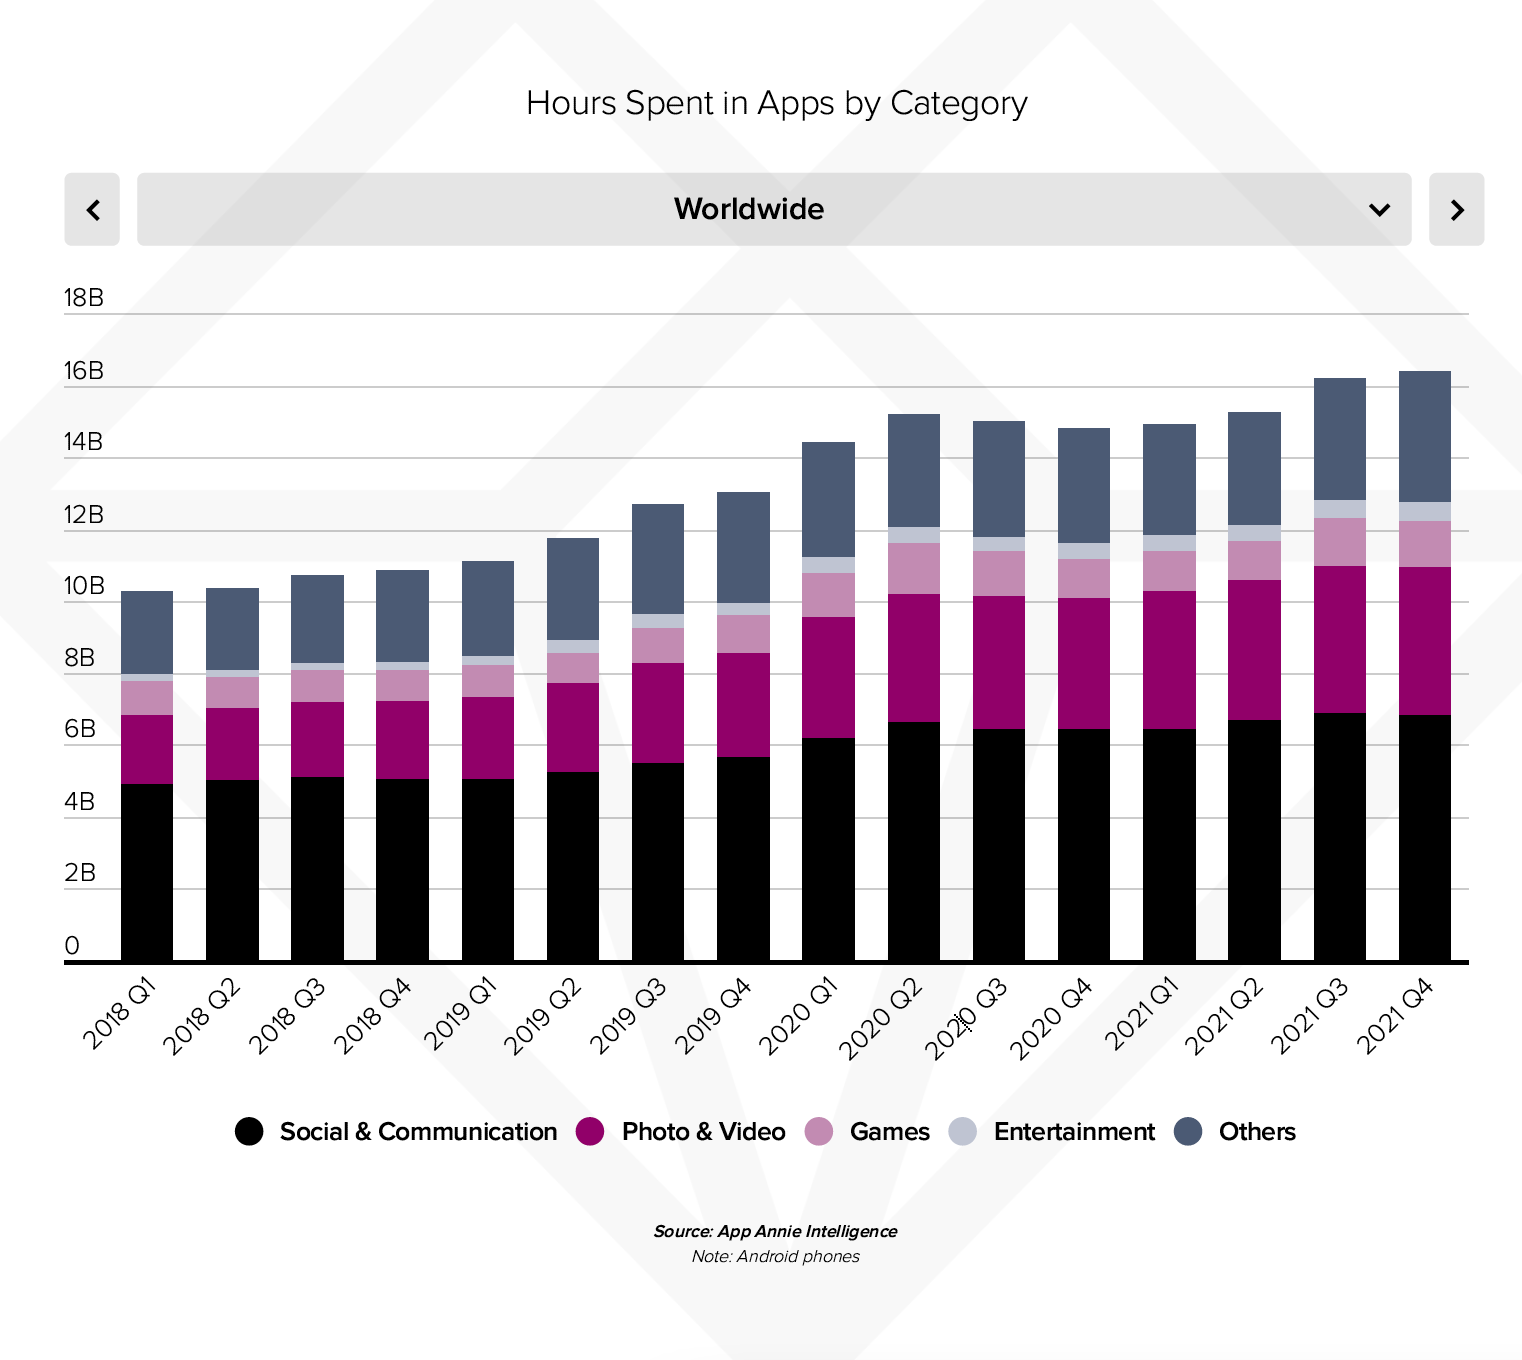
The pandemic accelerated existing mobile habits, which have solidified in 2021.
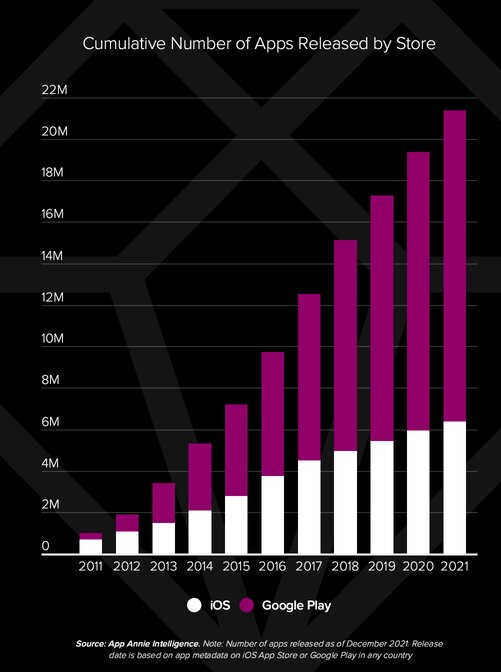
- Publishers Released 2 Million New Apps & Games in 2021
Google Play accounted for 77% of all apps and games releases in 2021. Across both iOS and Google Play, Games represented 15% of all new releases in 2021. The remaining 85% of new apps span all categories of the app stores, from mobile-first movers like social to mobile-forced industries like insurance and healthcare.
Apps are also removed and phased out overtime to leave the current live apps and games available to download on the app stores at 5.4 million (1.8 million on iOS and 3.6 million on Google Play).
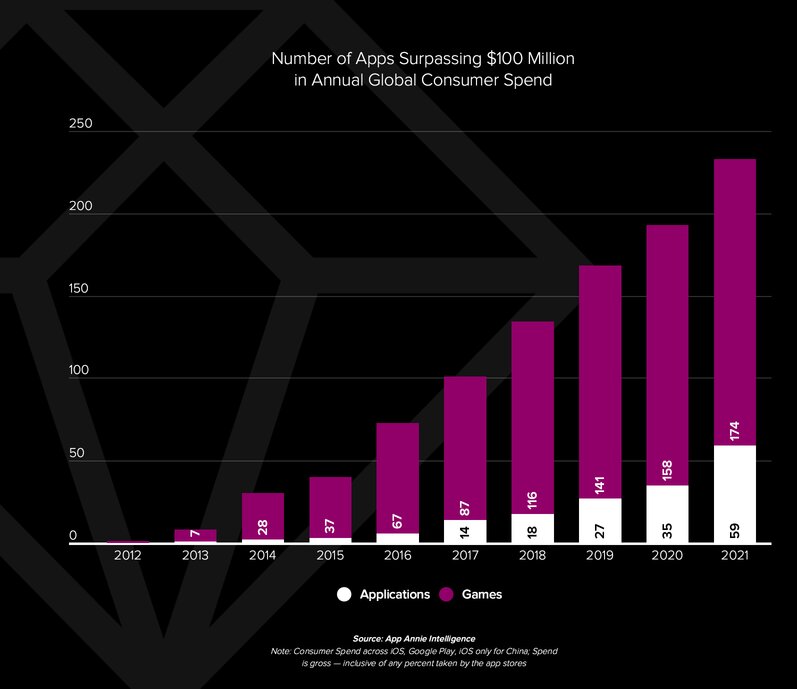
- 233 Apps & Games Generated Over $100 Million Dollars Annually in 2021
In 2021, there were over 230 apps and games surpassing $100M in annual consumer spend, with 13 of them surpassing $1 Billion.
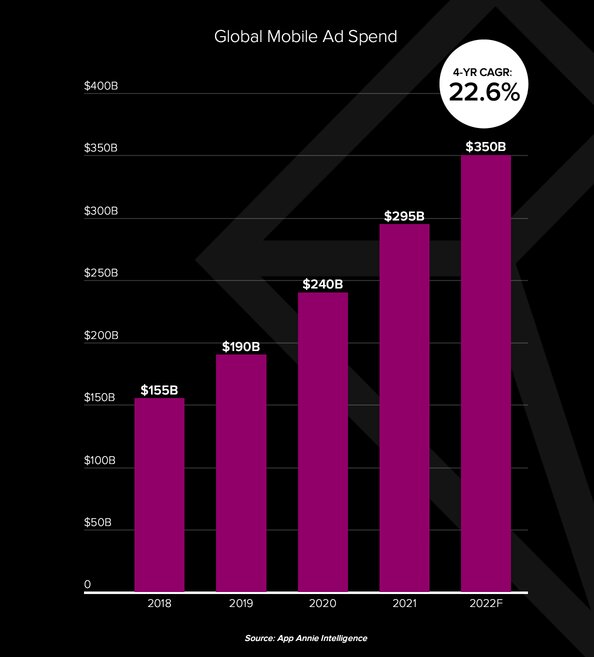
- Increased Global Mobile Ad Spend – $295B in 2021, up 23% YoY and Poised to Hit $350B in 2022.
Mobile is driving digital ad spend globally. Amidst an economic rebound with GDP up 5.9% in 2021, cyclical events like the Tokyo Olympics and EUFA tournament, and engrained mobile habits, ad dollars flowed to mobile as the primary and captive channel for engaging consumers — representing 70% of digital spend.
With the Beijing Olympics in 2022 and US mid-term elections, digital ad spend is set to be robust with the majority driven by mobile.
- Time in Shopping Apps Reached Over 100 Billion Hours Spent Globally
Time spent in Shopping apps rose 18% year-over-year, with strong movement in fast fashion, social shopping, and mobile-savvy big-box players.
Mobile shopping habits catalyzed during COVID-19 have solidified.
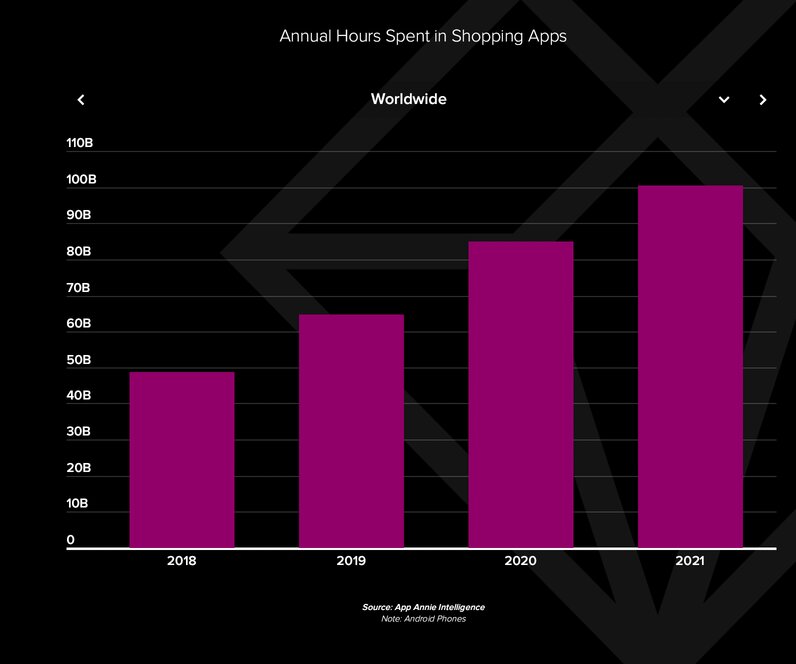
Annual Hours Spent in Shopping Apps
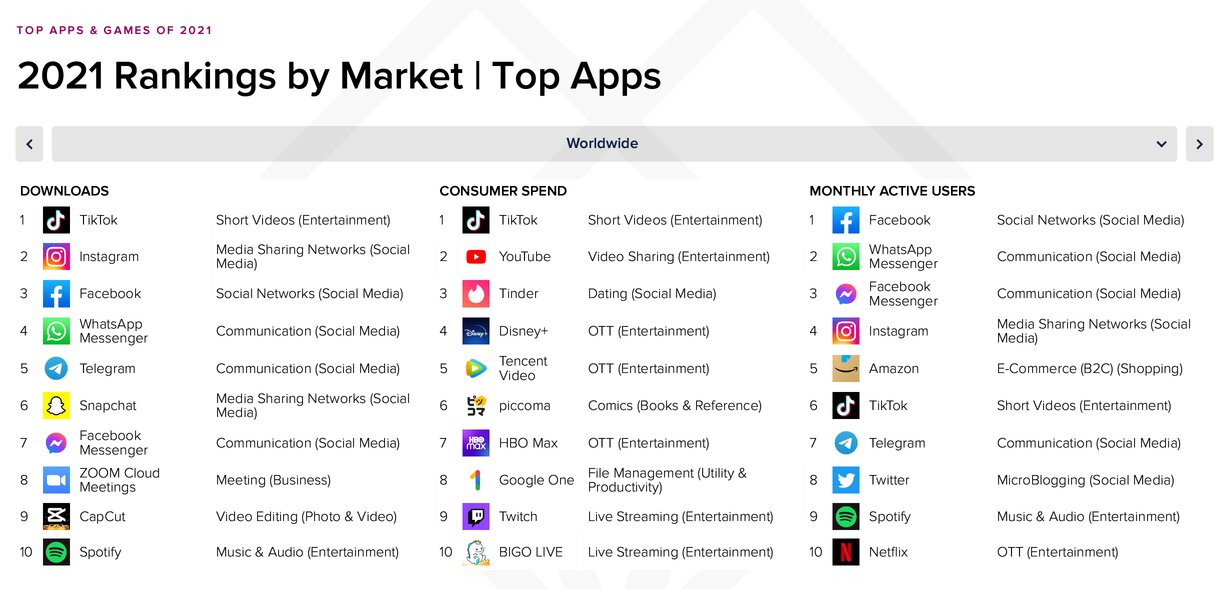
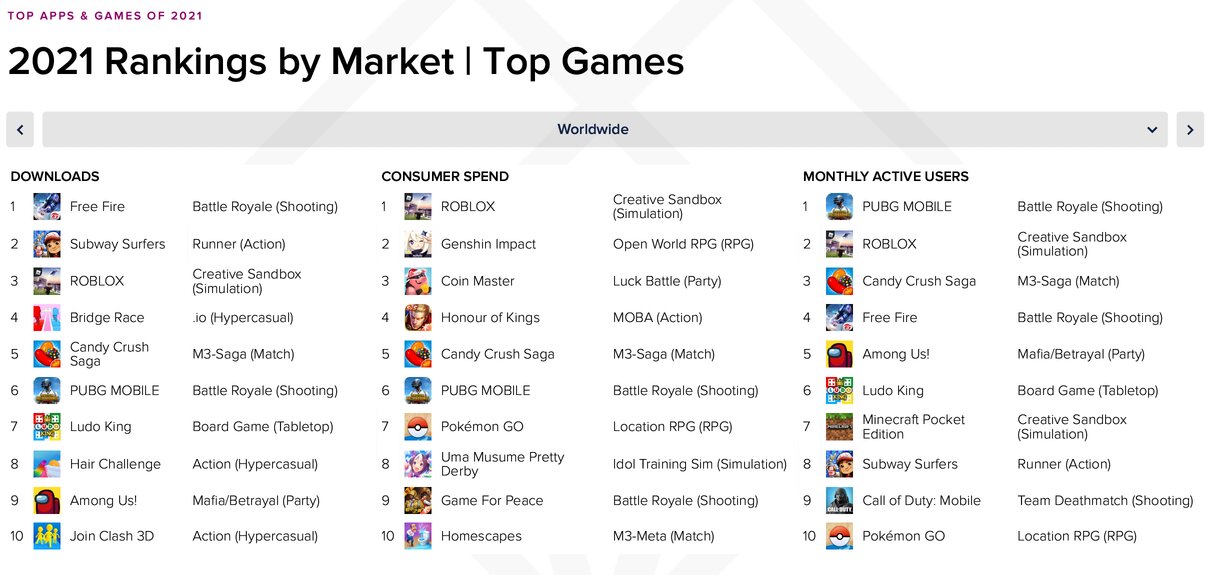
- Top Apps and Games 2021
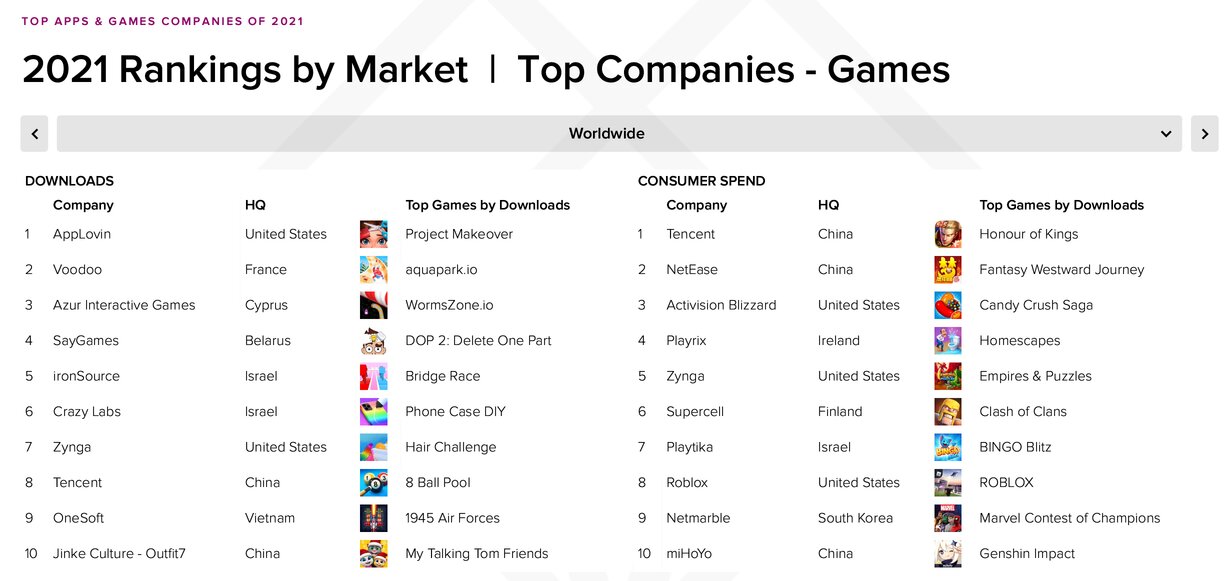
- Top Games 2021
Need help with developing a digital strategy for your business? Get in touch.


[…] Appnie’s State of Mobile 2022 Report. […]