The Statista dossier provides statistical information about social media marketing and advertising worldwide.
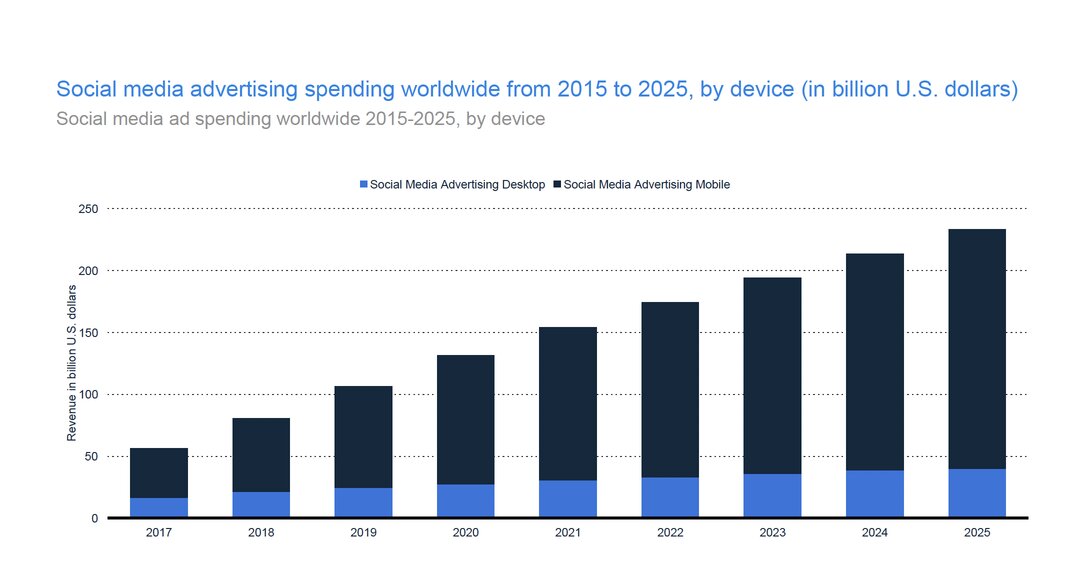
Social media advertising spending worldwide from 2015 to 2025, by device (in billion U.S. dollars)
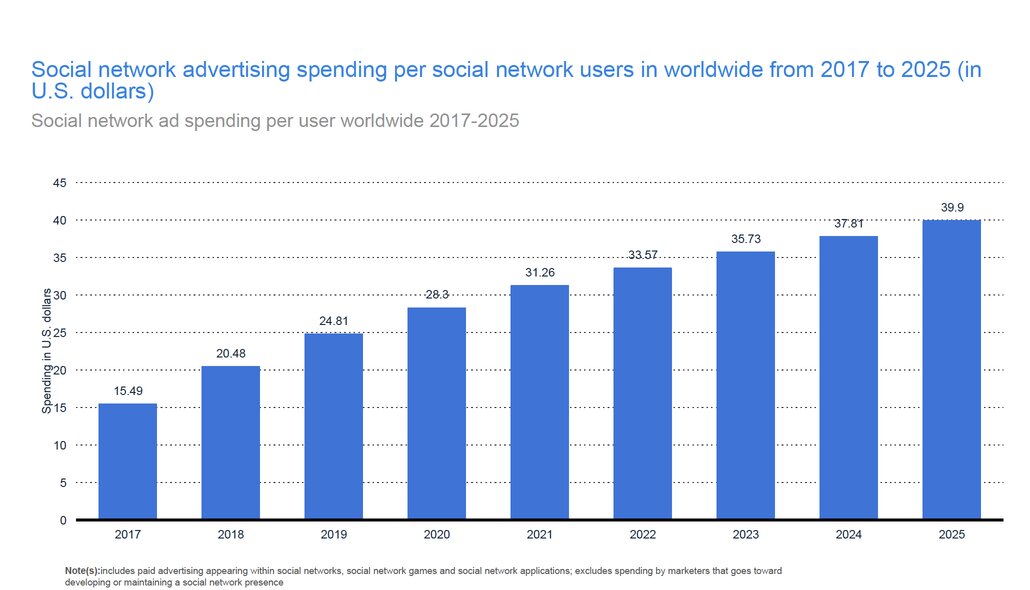
Social media ad spending worldwide 2015-2025, by device
The graph presents the social media advertising revenue worldwide in 2017 and provides a forecast thereof until 2025, broken down by device.
The global mobile social media ad revenue is expected to grow from 56.27 billion U.S. dollars in 2017 to 131.2 billion in 2020.
Statista’s Digital Market Outlook offers forecasts, detailed market insights, and essential performance indicators of the most significant areas in the “Digital Economy”, including various digital goods and services. Alongside revenue forecasts for 50 countries worldwide, Statista offers additional insights into consumer trends and demographic structure of digital consumer markets.
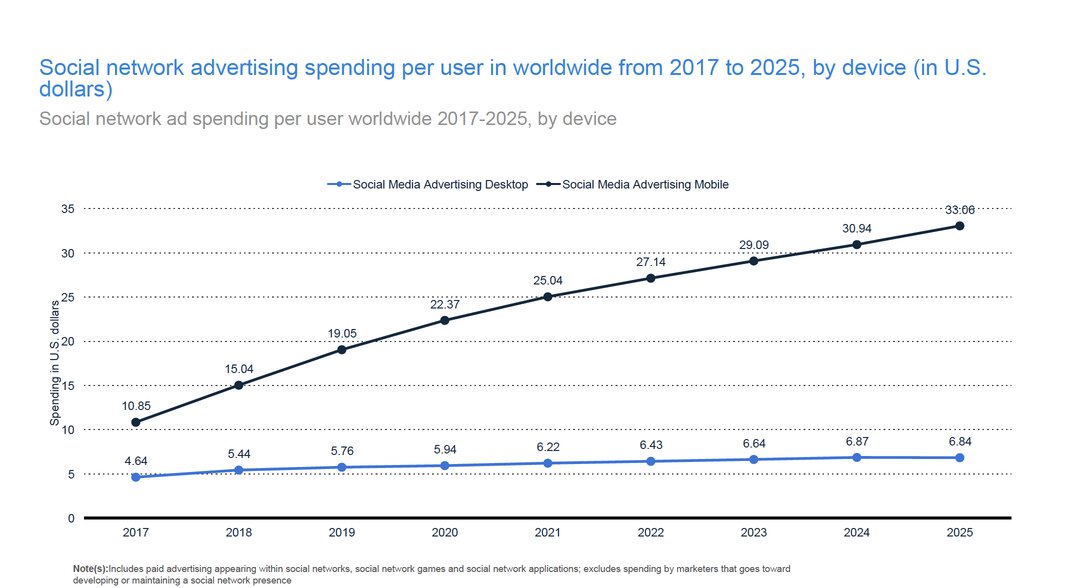
Social media ad spend growth worldwide 2020-2021
In 2020, the amount spend on advertisement per user worldwide increased around 3.5 U.S. dollars to 28.3 U.S dollars. According to the Statista Digital Market Outlook advertising spending per user in estimated to increase to almost 40 U.S dollars by 2025.
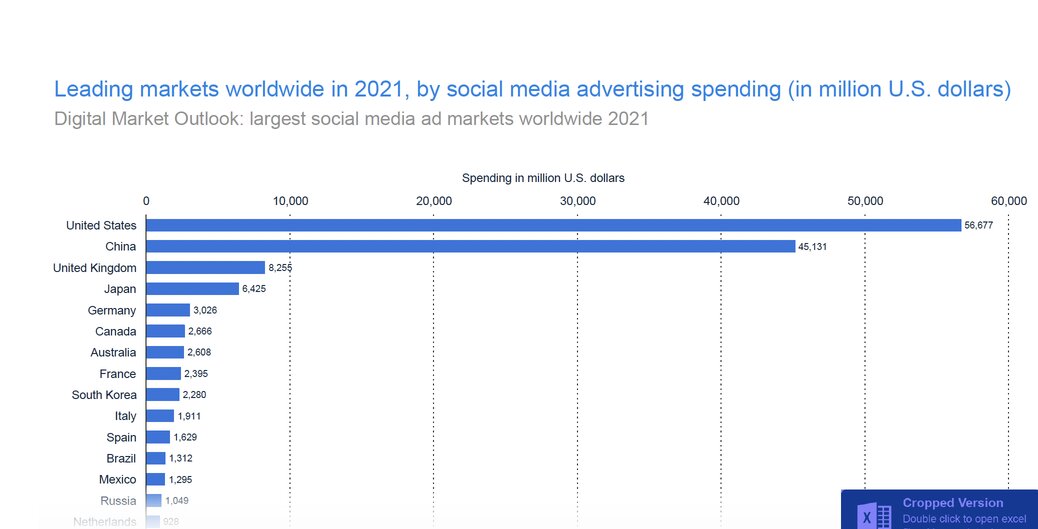
Leading markets worldwide in 2021, by social media advertising spending (in million U.S. dollars)
According to a global estimate, China would have a total digital search advertising spend of 45.13 billion U.S. dollars, right behind the U.S. with 56.68 billion dollars by the end of 2021.
Most popular digital marketing channels worldwide 2020
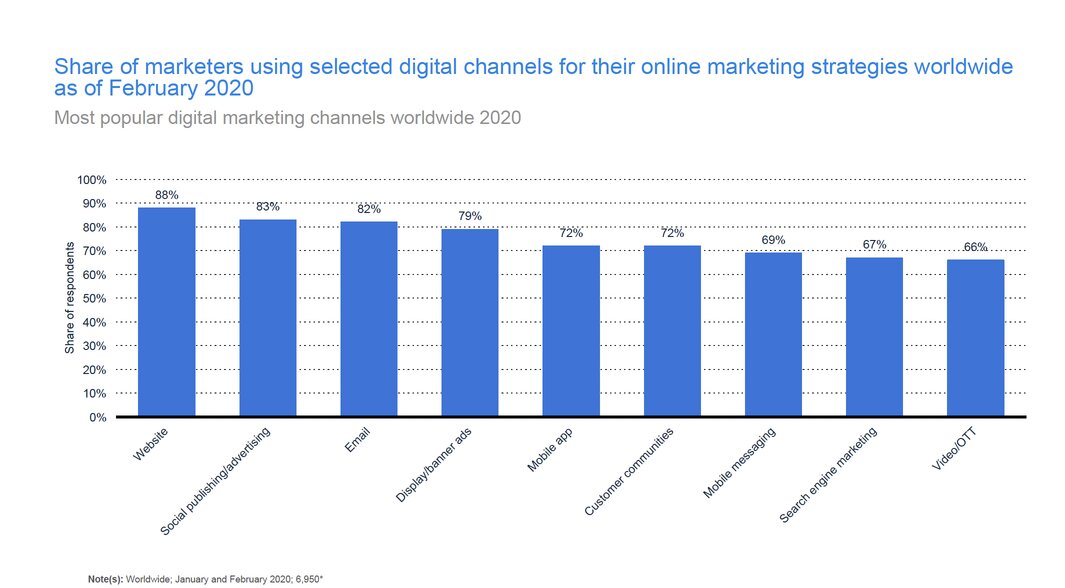
Share of marketers using selected digital channels for their online marketing strategies worldwide as of February 2020
During an early 2020 survey carried out among marketing leaders from 29 countries, 83 percent of respondents reported using social media as a digital channel for their marketing strategy. To compare, 67 percent of professionals said they used search marketing and 66 percent of videos or OTT.
Leading digital consumer engagement tactics worldwide 2021
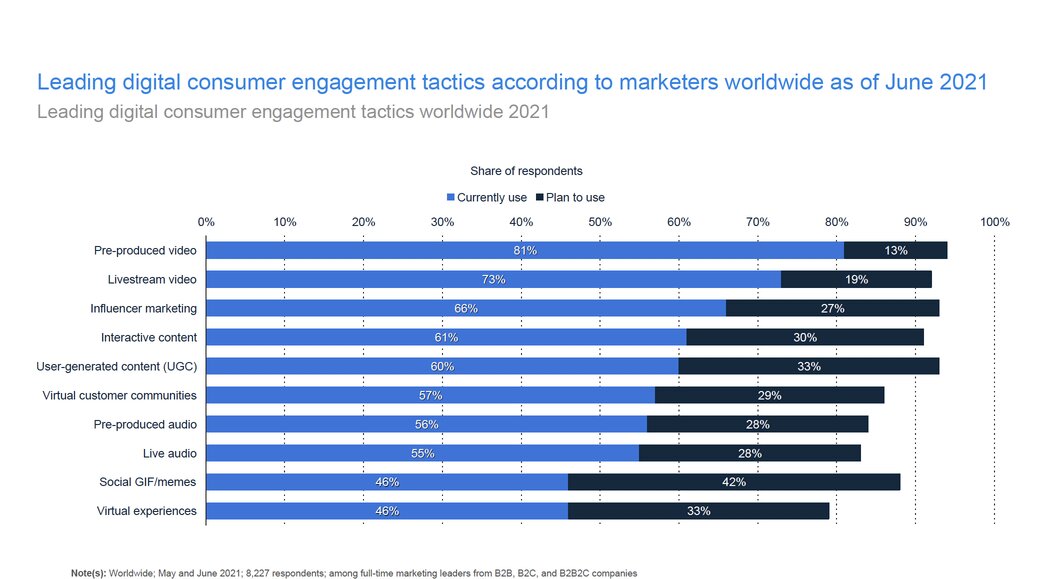
Leading digital consumer engagement tactics according to marketers worldwide as of June 2021
- Pre-produced video
- Livestream video
- Influencer marketing
- Interactive content
- User-generated content (UGC)
- Virtual customer communities
- Pre-produced audio
- Live audio
- Social GIF/memes
- Virtual experiences
During a 2021 survey carried out among marketing leaders worldwide, 81 percent of respondents stated they used pre-produced videos as a digital consumer engagement tactic, and another 13 percent said they were planning to do so. For pre-produced audio, the figures stood at 56 and 28 percent, respectively.
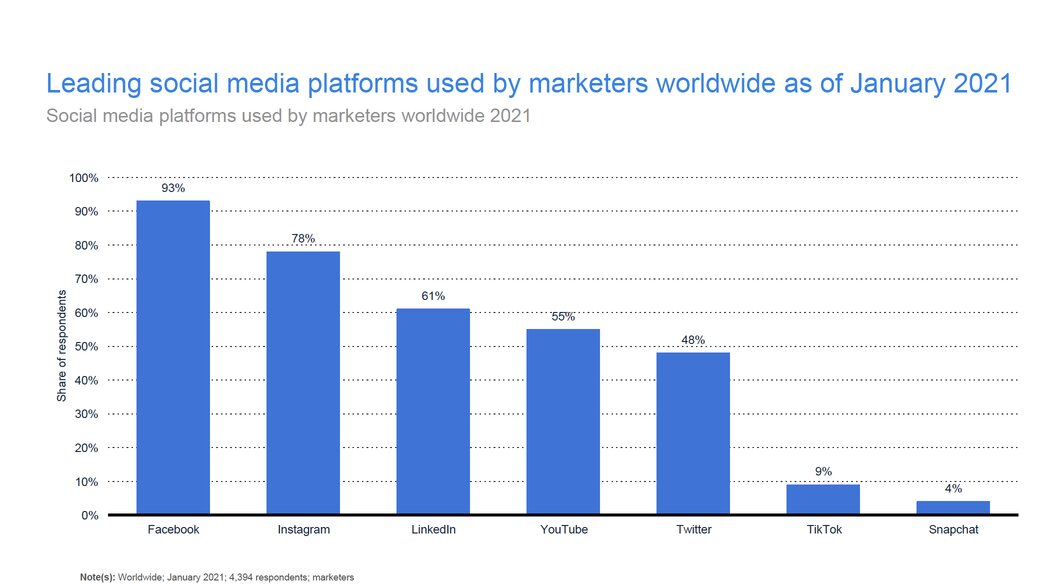
Leading social media platforms used by marketers worldwide as of January 2021
Social media platforms used by marketers worldwide 2021
- Facebook – 93%
- Instagram – 78%
- LinkedIn – 61%
- YouTube – 55%
- Twitter – 48%
- TikTok – 9%
- Snapchat – 4%
As of January 2021, Facebook was the most commonly used social media platform among marketers worldwide.
According to a global survey, 93 percent of responding social media marketers used the network to promote their business, while another 78 percent did so via Instagram.
Marketing channels using automation worldwide as of June 2021
Most often automated marketing channels worldwide 2021
- Email marketing
- Social media management
- Landing pages
- Paid ads
- Campaign tracking
- Content management
- SEO efforts
- Account-based marketing
- SMS marketing
- Lead scoring
- Workflows / automation visualization
- Sales funnel communications
- Push notifications
- Live chat
- Dynamic web forms
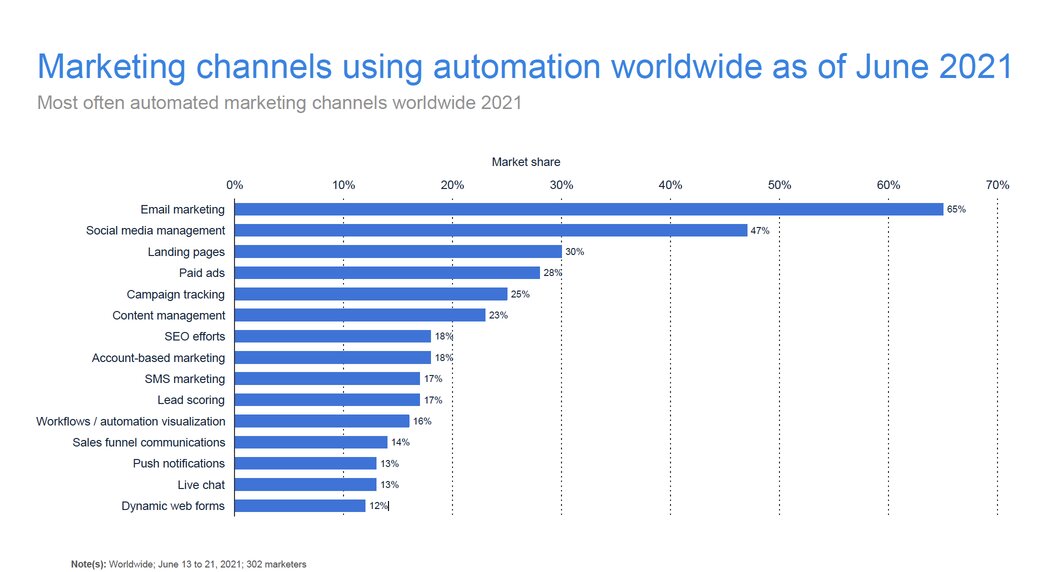
During a June 2021 survey carried out among marketers, 47 percent of respondents stated they used automation in their social media marketing efforts. Email marketing was the most often automated channel, named by 65 percent of respondents.
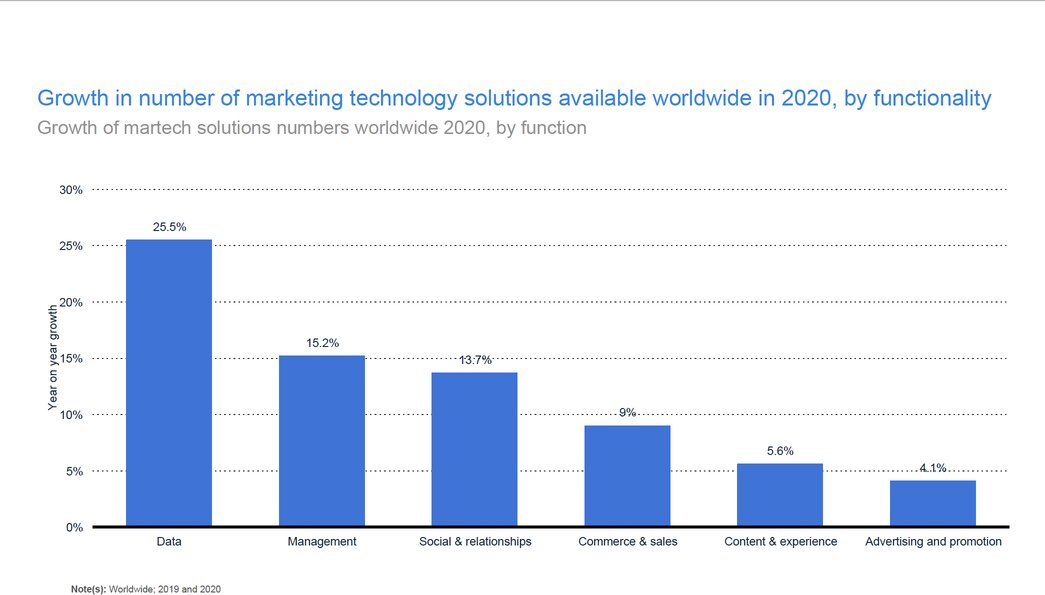
Growth in number of marketing technology solutions available worldwide in 2020, by functionality
Growth of martech solutions numbers worldwide 2020, by function
The results of an annual study evaluating the state of marketing technology around the globe show, that the number of martech solutions worldwide is constantly growing. Marketing technology tool were the fastest to grow in numbers between 2019 and 2020, at 25.5 percent, followed by management martech solutions at 15.2 percent growth. In general the entire landscape grew by 13.6 percent compared to 2019.
Cost-per-mille (CPM) of ads on selected social media platforms worldwide as of October 2021 (in U.S. dollars)
Social media ads CPM worldwide 2021, by platform
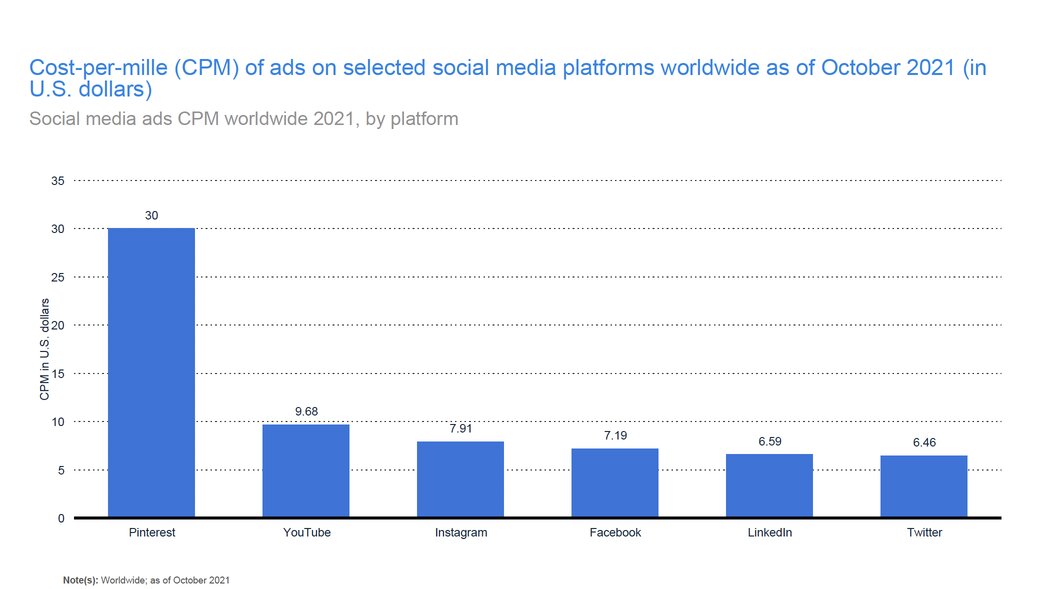
Pinterest has highest CPM
The cost-per-mille of advertising on social media was 6.37 U.S. dollars in the second quarter of 2021. In other words, advertisers had to pay this much to have their ads viewed by a thousand potential customers. Social media CPM is considerably higher in the final quarters of each year, reaching close to, or above six dollars. The surge in costs is prompted by increased demand for advertising space during that time, as brands compete to win over prospective clients.
As of October 2021, the cost-per-mille (CPM) of YouTube ads stood at 9.68 U.S. dollars. Among the social networks presented in the data set, Pinterest had the highest CPM, with 30 dollars, whereas Twitter had the lowest CPC with 6.46 dollars.
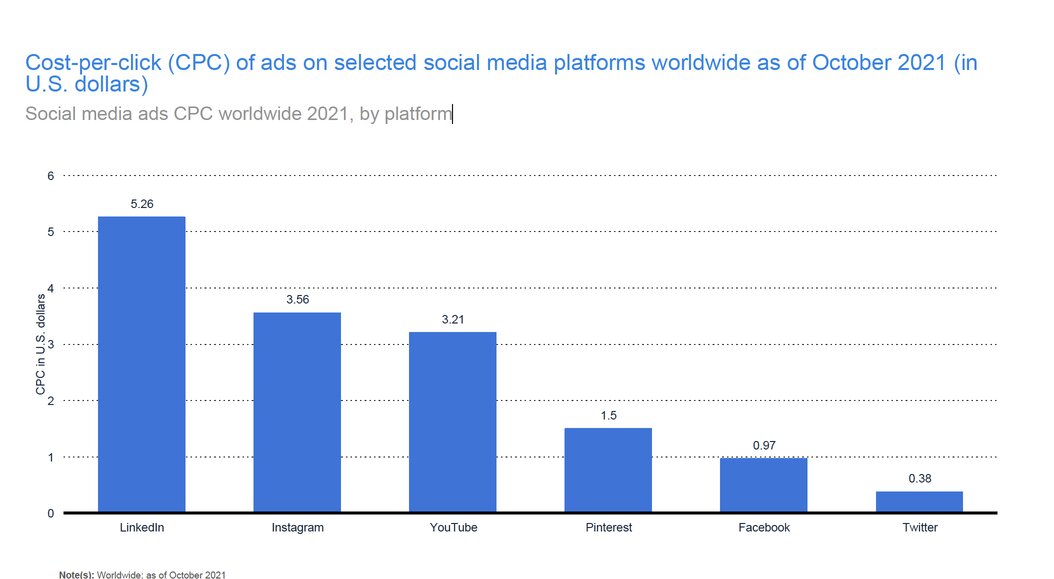
Cost-per-click (CPC) of ads on selected social media platforms worldwide as of October 2021 (in U.S. dollars) Social media ads CPC worldwide 2021, by platform
Linkedin – Highest CPC
As of October 2021, cost-per-click (CPC) of YouTube ads stood at 3.21 U.S. dollars. Among the social networks presented in the data set, LinkedIn had the highest CPC, with 5.26 U.S. dollars whereas twitter had the lowest CPC with 0.38 U.S. dollars.
Leading benefits of using social media for marketing purposes worldwide as of January 2021
Benefits of social media marketing worldwide 2021
- Increased exposure
- Increased traffic
- Generated leads
- Developed loyal fans
- Improved sales
- Provided marketplace insight
- Grew business partnerships
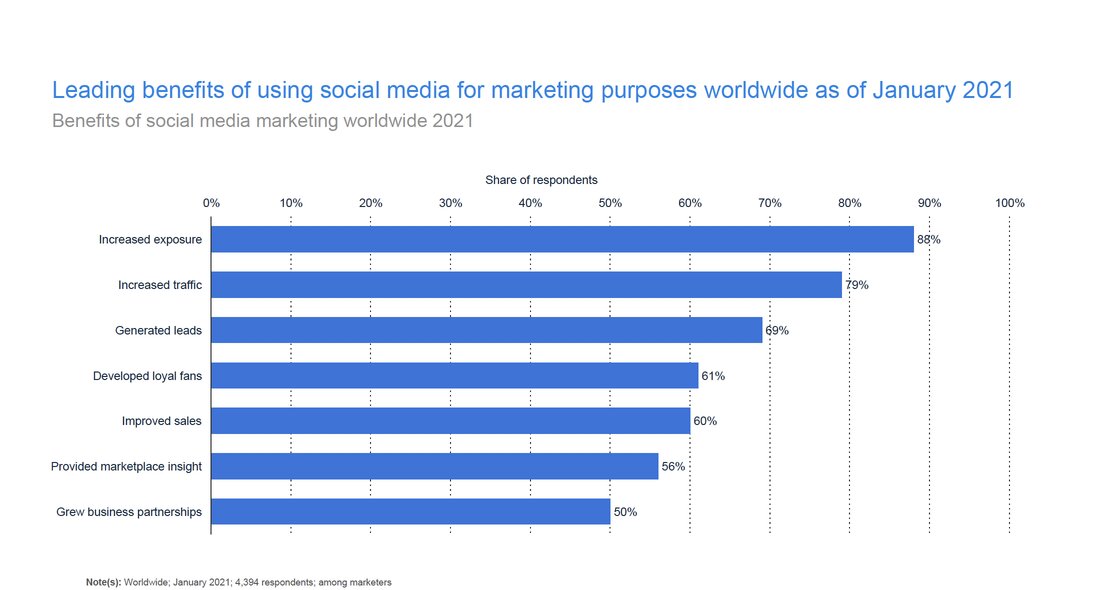

Benefits of Social Media Marketing
Increased exposure is the most commonly cited advantage of using social media for marketing purposes among global industry professionals. This is unsurprising given the huge appeal of having billions of active users as a potential advertising audience. Improved traffic, lead generation and growing fan loyalty are further reasons why marketers see value in employing social networks in their campaigns. Facebook, Instagram and LinkedIn are the top three most used social platforms among global marketers .
Digital marketing channels most effective in driving sales according to SMBs worldwide in 2021
Digital marketing channels effective in driving sales for SMBs worldwide 2021
- E-mail marketing –36.1%
- Social media marketing – 18.9%
- Landing pages – 11.2%
- Advertising – 8.3%
- Content marketing – 7.5%
- Web push notifications – 1.7%
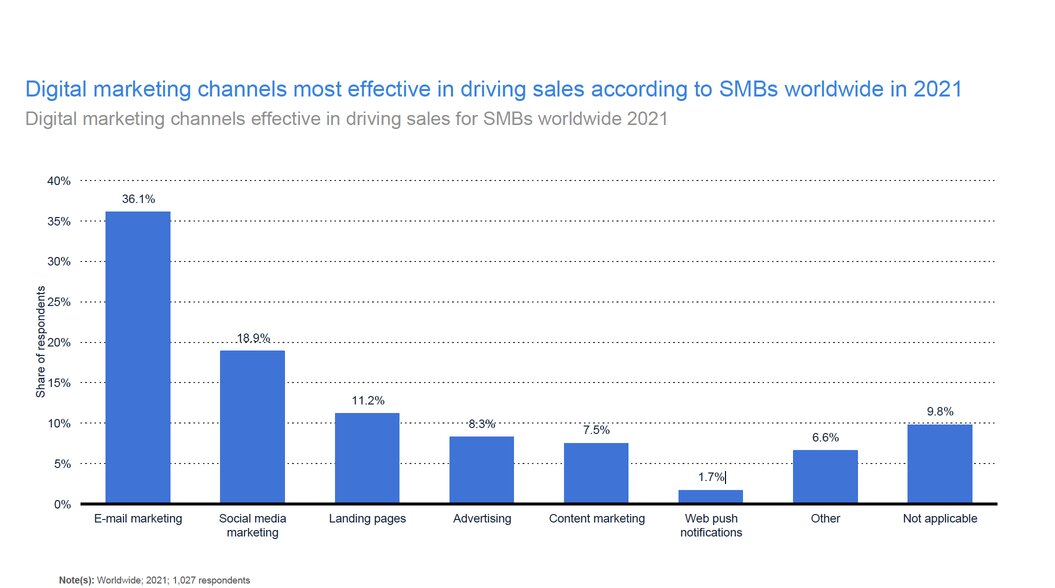
A 2021 survey of global SMS found that 36.1 percent of respondents believed that e-mail marketing was the most effective in driving sales for them. At the same time,18.9 percent of SMBs thought that social media marketing was best at driving sales.
Marketing channels with the best return on investment for global e-commerce companies as of October 2019
Marketing channels with the best ROI for global e-commerce companies 2019:
- Organic search
- Direct
- Paid search
- Retargeting
- Social
- Referral
- Other
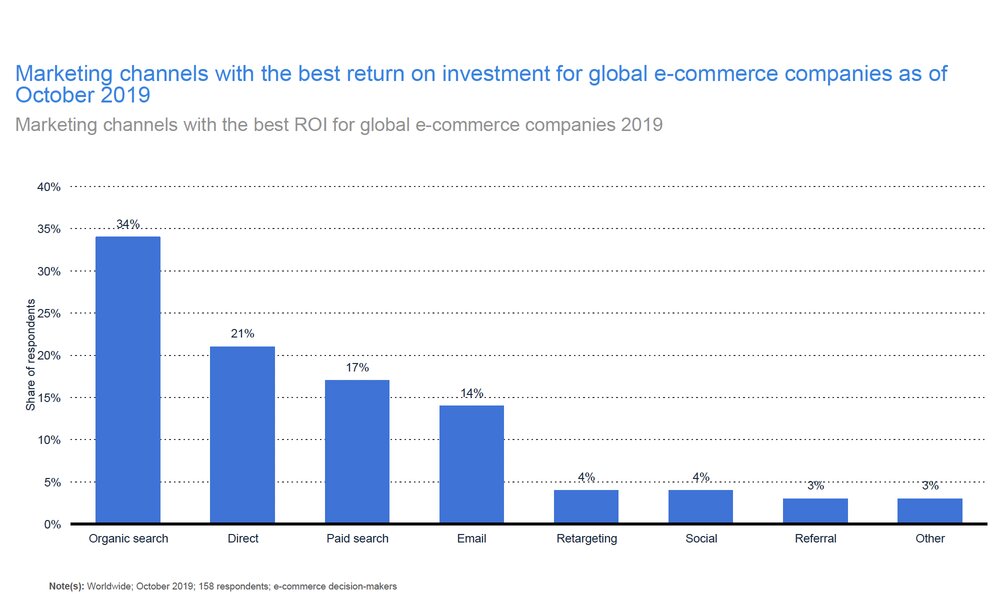
Organic search marketing was the channel with the biggest return on investment (ROI) according to a survey of e-commerce decision-makers in October 2019. Direct marketing was ranked second with 21 percent of respondents claiming this channel to generate the best ROI for them.
Leading media companies worldwide in 2020, ranked by advertising revenue (in billion U.S. dollars)
Leading media owners worldwide 2020, by ad revenue
- Google – 131.9
- Facebook – 86.7
- Alibaba – 28.6
- Bytedance – 28
- Amazon – 20.3
- Comcast – 12.8
- Tencent – 12.6
- Disney – 11.2
- Baidu – 11.2
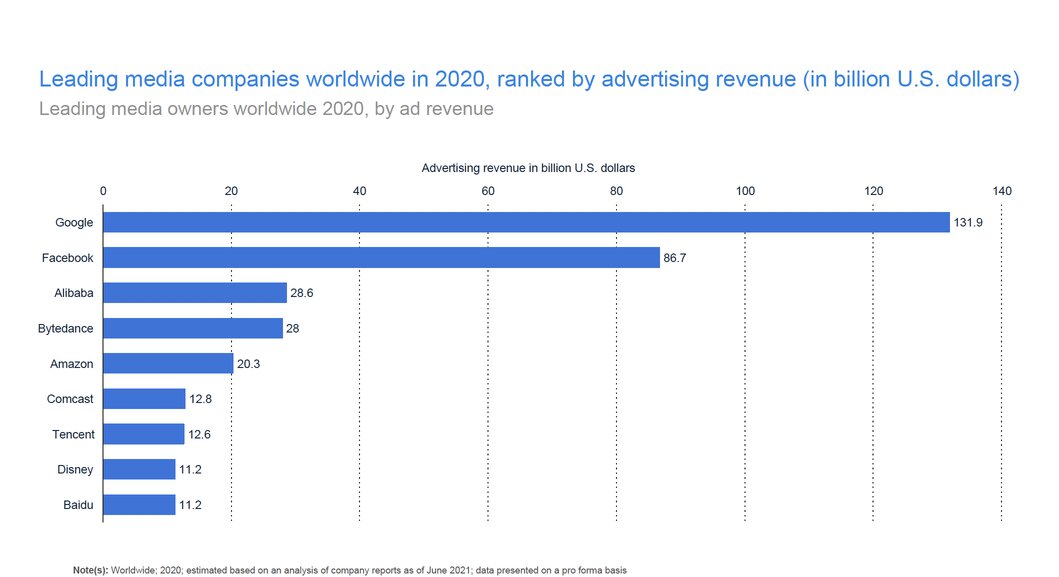
In 2020, Google was the largest media company worldwide, with advertising revenues of nearly 132 billion U.S. dollars. Advertising revenue of Bytedance – the owner of TikTok – amounted to 28 billion U.S. dollars, placing it on place four in the global ranking. Bytedance managed to beat Amazon, as well as Disney, Tencent, and other top players in the media industry.
Leading media and entertainment brands worldwide in 2021, by brand value (in billion U.S. dollars)
Most valuable media & entertainment brands worldwide 2021
- Google – 458
- Tencent – 240.93
- Facebook – 226.74
- Instagram – 82.9
- Netflix – 71.13
- Disney – 55.22
- YouTube – 47.1
- TikTok – 44.52
- LinkedIn – 35.52
- Baidu – 23.36
- Snapchat – 21.61
- Spotify – 19.28
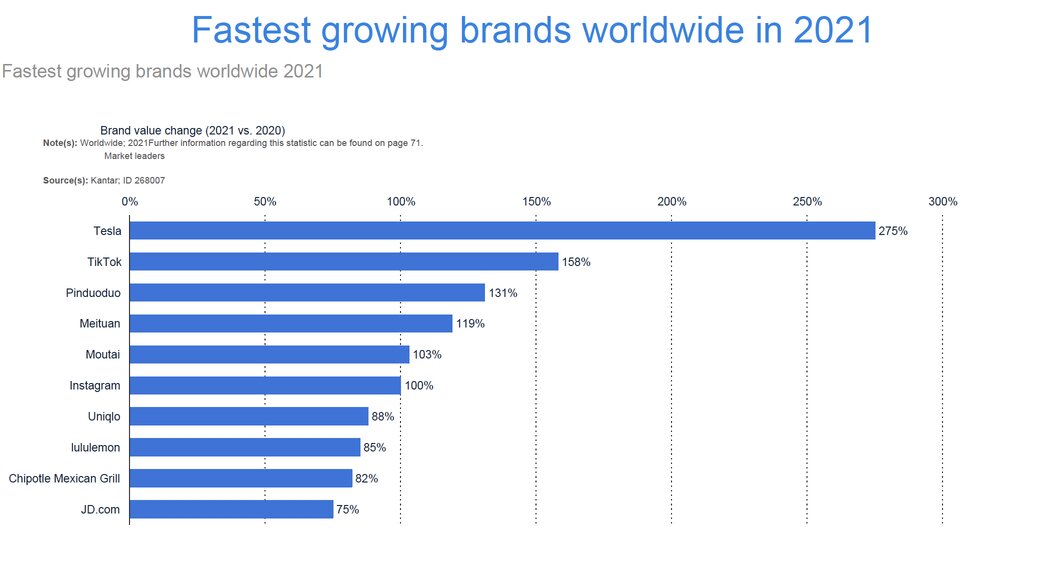
Fastest growing brands worldwide 2021
- Tesla
- TikTok
- Pinduoduo
- Meituan
- Moutai
- Uniqlo
- lululemon
- Chipotle Mexican Grill
- JD.com
The statistic shows the largest brand value change of the biggest brands in the world in 2020 compared to 2019.
Leading social media marketing SaaS companies 2020
Leading business-to-business (B2B) social media marketing software as a service (SaaS) companies worldwide as of January 2020, by annual recurring revenue (in million U.S. dollars)
- Avista Advantage – 267
- Anonymous Content – 81
- Crowdfire – 54
- ZOO Digital – 44
- Later – 29
- Canvass – 18
- SocialAppsHQ – 18
- Buffer – 14
- Tawkify – 13
- ContentCal – 12
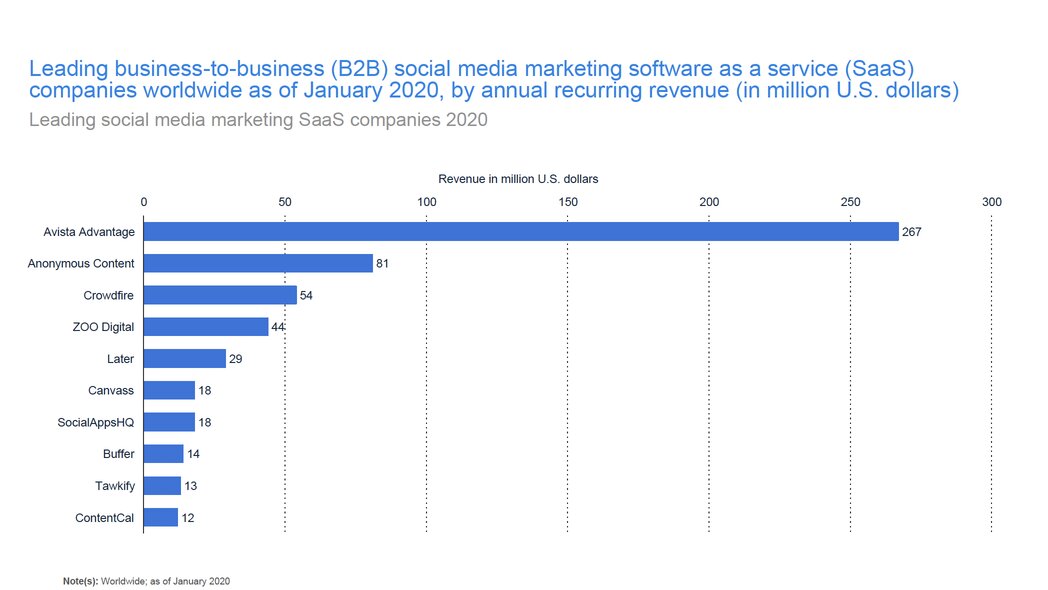
As of January 2020, Avista Advantage was the leading social media marketing software as a service (SaaS) company, with 267 million U.S. dollars in annual recurring revenue. Anonymous Content ranked second, with a revenue of 81 million dollars.
Number of social network users worldwide from 2017 to 2025 (in billion)
- 2017 – 2.86
- 2018 – 3.14
- 2019 – 3.4
- 2020 – 3.6
- 2021 – 3.78
- 2022 – 3.96
- 2023 – 4.12
- 2024 – 4.27
- 2025 – 4.41
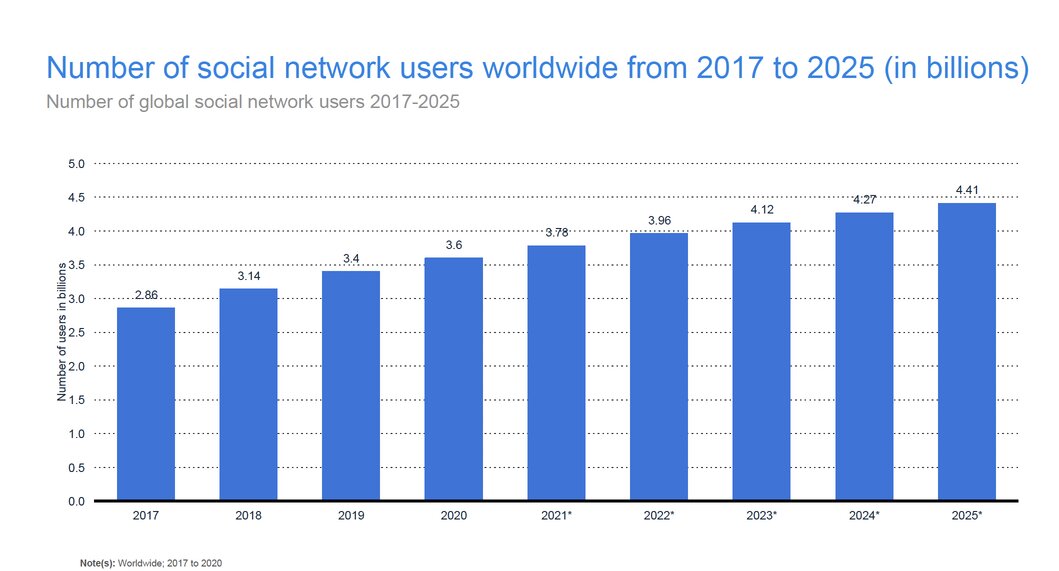
Social media usage is one of the most popular online activities. In 2020, over 3.6 billion people were using social media worldwide, a number projected to increase to almost 4.41 billion in 2025.
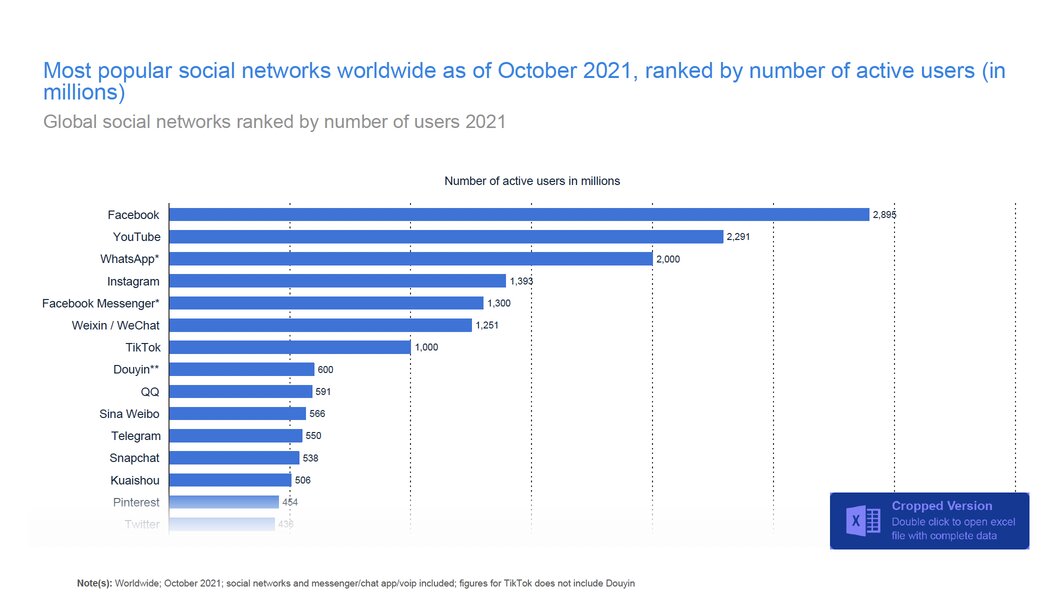
Most popular social networks worldwide as of October 2021, ranked by number of active users (in millions)
Global social networks ranked by number of users 2021
- Facebook – 2,895
- YouTube- 2,291
- WhatsApp – 2,000
- Instagram – 1,393
- Facebook Messenger – 1,300
- Weixin / WeChat – 1,251
- TikTok – 1,000
- Douyin – 600
- QQ – 591
- Sina Weibo – 566
- Telegram – 550
- Snapchat – 538
- Kuaishou – 506
- Pinterest – 454
- Twitter – 436
Time Spent on Social Media
Social media is an integral part of daily internet usage. On average, internet users spend 144 minutes per day on social media and messaging apps, an increase of more than half an hour since 2015. On average, internet users in Latin America had the highest average time spent per day on social media .
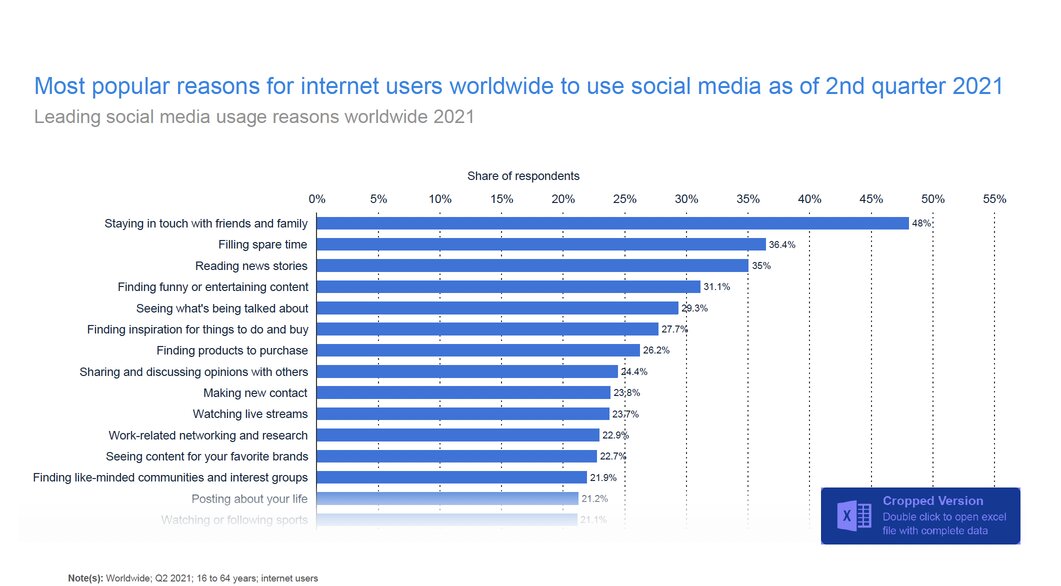
Leading social media usage reasons worldwide 2021
Most popular reasons for internet users worldwide to use social media as of 2nd quarter 2021
- Staying in touch with friends and family -48%
- Filling spare time – 36.4%
- Reading news stories – 35%
- Finding funny or entertaining content – 31.1%
- Seeing what’s being talked about – 29.3%
- Finding inspiration for things to do and buy – 27.7%
- Finding products to purchase – 26.2%
- Sharing and discussing opinions with others – 24.4%
- Making new contact – 23.8%
- Watching live streams – 23.7%
- Work-related networking and research – 22.9%
- Seeing content for your favorite brands – 22.7%
- Finding like-minded communities and interest groups – 21.9%
- Posting about your life – 21.2%
- Watching or following sports – 21.1%
Level of trust in selected media sources worldwide as of November 2020
- Search engines – 56%
- Traditional media -53%
- Owned media – 41%
- Social media – 35%
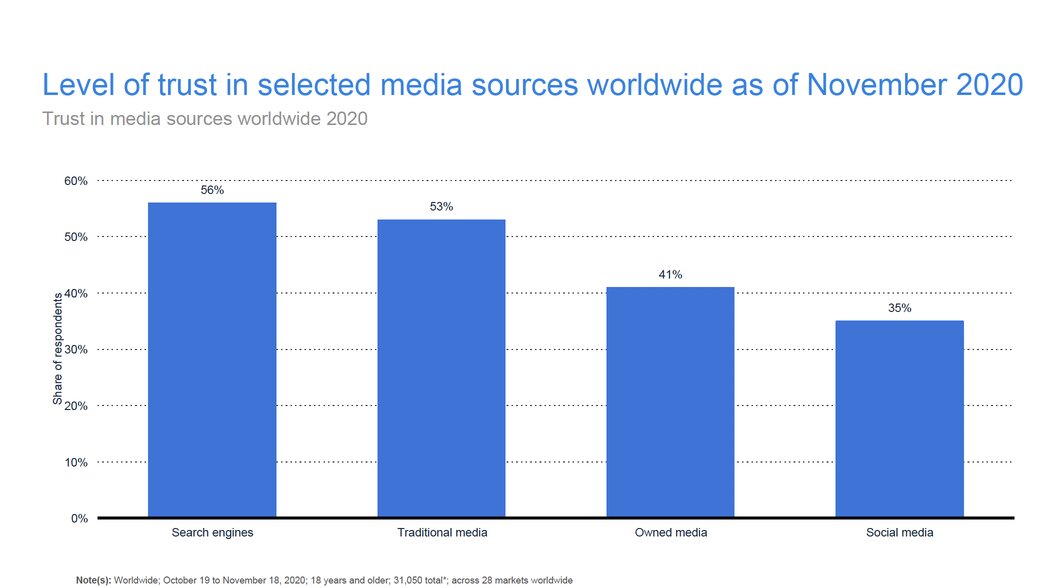
Data on the level of trust in selected media sources worldwide as of November 2020 showed that 53 percent of respondents stated that they trusted traditional media to provide general news and information, compared to just 35 percent who considered social media trustworthy.
Need help with developing a digital strategy for your business? Get in touch.